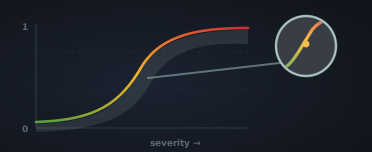
An injury-risk function is a mathematical model that links a measured or simulated impact variable to the estimated probability of a defined injury outcome.
The input may be a head kinematic measure, such as peak linear acceleration, peak rotational acceleration or peak rotational velocity. It may also be a tissue-level response predicted by a finite-element model, such as maximum principal strain in the whole brain or in a specific brain region. The output is not a diagnosis. It is an estimated probability, based on the data and assumptions used to build the model.
You can think of an injury-risk function as a curve. On the horizontal axis is the impact measure. On the vertical axis is the estimated probability of the specified injury outcome. At low values, the curve is usually close to zero. As the input increases, the estimated probability rises. At high values, the curve may approach one, although the shape depends on the model and the available data.
Why a Curve, Not a Threshold?
A single threshold is tempting: below this value, no injury; above it, injury. Real impacts are not that simple.
Different people may experience similar head loading but have different clinical outcomes. This can reflect differences in anatomy, impact direction, previous exposure, age, sex, neck posture, protective equipment, and many other factors. Some of these are measurable; many are not captured in typical datasets. There is also uncertainty in the measurements themselves, in the injury diagnosis, and in any finite-element model used to estimate brain tissue response.
An injury-risk curve therefore does not claim to identify the exact tolerance of one individual. Instead, it summarises a population-level relationship: in the dataset used to fit the model, impacts with larger predictor values were associated with a higher probability of the defined injury outcome.
This is why an IRF should be interpreted as a risk estimate, not as a clinical decision on its own.
How Researchers Build One
The basic process is:
-
Collect a dataset of impacts with known outcomes, such as injured versus uninjured, or a more specific endpoint such as concussion, loss of consciousness, skull fracture, or another clinically defined outcome.
-
Pair each case with one or more predictors. These may be measured head kinematics, such as acceleration or velocity, or simulated tissue responses, such as brain strain.
-
Fit a statistical model, commonly logistic regression or a survival-type model, to estimate how injury probability changes with the predictor.
-
Report the resulting curve, the model parameters, the confidence intervals or uncertainty bands, and the dataset from which the curve was derived.
The last point is important. An IRF is only as generalisable as its source data. A curve developed from automotive tests, cadaver experiments, professional American football reconstructions, cycling helmet impacts, or instrumented rugby data may not transfer directly to another population or injury endpoint.
What Makes IRFs Different from Simple Metrics?
A metric gives a value. For example, one impact may have a peak rotational velocity of 35 rad/s, a peak rotational acceleration of 5000 rad/s², or a predicted brainstem strain of 0.18.
An IRF tries to interpret that value in relation to injury risk. It asks: based on previous data, how often was this type of outcome observed at this level of loading or tissue response?
That makes IRFs useful, but also easy to misuse. The risk estimate depends on the injury definition, the population, the impact conditions, the measurement system, and the statistical model. A “50% risk” value from one IRF does not necessarily mean the same thing as a “50% risk” value from another IRF.
How trace* Interprets Biomechanical Severity
In trace*, injury-risk functions are being developed to connect on-field head impact measurements with interpretable estimates of injury risk. The aim is to move beyond reporting only raw kinematic values or predicted tissue responses, and towards a clearer statement of what those values may imply for a specific injury endpoint.
For example, an impact may first be converted into predicted regional brain strain. An injury-risk function can then translate that tissue response into an estimated probability of a defined outcome, such as loss of consciousness, provided that the IRF was developed for that endpoint and is appropriate for the impact context.
Until a trace*-specific IRF has been fully developed, validated, and published, outputs in the demo should be treated as exposure or biomechanical severity estimates rather than clinical risk predictions. They can help identify impacts that are mechanically larger or potentially more concerning, but they should not be interpreted as a diagnosis or as a replacement for medical assessment.
Sources & further reading
- Rowson, S. et al. (2012) — Rotational head kinematics in football impacts: an injury risk function for concussion. Annals of Biomedical Engineering 40 (1).
- Takhounts, E. G. et al. (2013) — Development of Brain Injury Criteria (BrIC). Stapp Car Crash Journal 57.
- Sanchez, E. J. et al. (2018) — Evaluation of head and brain injury risk functions using sub-injurious human volunteer data. J. Neurotrauma 35 (20).