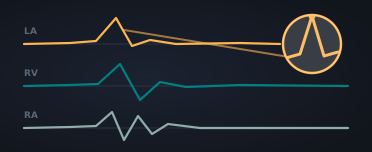
Every impact the mouthguard records gets distilled into a handful of headline numbers. Once you know what they’re measuring, the report card on a match becomes a lot easier to read.
The three you’ll see most often
- PLA — Peak Linear Acceleration (in g, where 1 g = the acceleration of gravity). This is how hard the head is speeding up or slowing down in a straight line. A jump from sitting to standing peaks around 2 g. A boxer’s hook to the jaw peaks around 70–100 g. The unit you see on the app is the resultant, meaning the combined effect across all three axes.
- PRV — Peak Rotational Velocity (in rad/s or radians per second). This is how fast the head is spinning about its centre of mass at the most violent moment of the impact. A pirouette is about 10 rad/s; a heavy tackle to the head can reach 30 rad/s.
- PRA — Peak Rotational Acceleration (in rad/s², or krad/s² to keep the numbers readable). How fast the rotation itself is changing. This is what biomechanists believe drives most of the strain injury risk in the brain tissue.
Why rotation matters more than acceleration
A famous result from the brain-injury literature: for the same peak linear acceleration, a head movement that includes a fast rotation produces dramatically more strain inside the brain than a purely linear one. The skull is a roughly rigid container; the brain inside it is closer to a stiff jelly that can twist independently. When the head rotates quickly, the brain’s tissue shears against itself, especially along the long white-matter tracts that connect different regions.
That’s why peak rotational velocity (PRV) and rotational acceleration (PRA) carry the most weight in injury-risk models, and why trace* pays close attention to them when predicting per-region strain. When US regulators built a dedicated rotational injury metric — the Brain Injury Criterion (BrIC) — they found that peak rotational velocity, not acceleration, was the better predictor of diffuse brain injury (Takhounts et al., 2013), and field studies that instrumented real concussions in six degrees of freedom reach the same conclusion (Hernandez et al., 2015).
How they appear in the app
Open any impact in the demo and you’ll see three traces stacked vertically:
- Linear Acceleration (g) — the X, Y, and Z components plus the resultant.
- Rotational Velocity (rad/s) — same three components.
- Rotational Acceleration (krad/s²) — same.
The headline number in the top-right of each plot is the peak resultant magnitude — the single worst moment across all axes. That’s the figure you’ll see quoted in match reports.
Two cautions
- A high PLA on its own isn’t necessarily injurious. A sneeze can produce 3 g; a header in football can hit 20 g without anyone losing consciousness.
- A high PRA on its own isn’t necessarily injurious either, but PRA + duration is the combination that does most of the damage. A short sharp jolt is very different from a longer rotational load.
This is the reason trace* doesn’t stop at the headline numbers — it uses the whole shape of the kinematic window to estimate strain across the brain, region by region.
Sources & further reading
- Jones, C. et al. (2023) — Validation of the Protecht instrumented mouthguard. Sensors 23 (16), 7068.
- Takhounts, E. G. et al. (2013) — Development of Brain Injury Criteria (BrIC). Stapp Car Crash Journal 57. — Concludes rotational velocity (not rotational acceleration) is the better predictor of diffuse brain injury.
- Hernandez, F. et al. (2015) — Six degree-of-freedom measurements of human mild traumatic brain injury. Annals of Biomedical Engineering 43 (8).